Debugging: Difference between revisions
No edit summary |
(Add visibility debug display) |
||
| (35 intermediate revisions by 2 users not shown) | |||
| Line 1: | Line 1: | ||
This article explains how to debug Arx | This article explains how to debug Arx Libertatis. | ||
== Linux == | == Script console == | ||
{{Main|Script console}} | |||
Arx Libertatis 1.2 and newer comes with a console that can run arbitrary script commands. In debug builds and [[development snapshots]] it can be opened using the hotkey (` by default) while in release builds a [[Cheats#Script console|cheat spell]] is required to unlock the hotkey. | |||
== Debug views == | |||
<code>F11</code> cycles through various debug information displays: | |||
<gallery widths=320px heights=240px> | |||
image:Debug_info_fps.jpg|FPS counter | |||
image:Debug_info_fps_graph.jpg|FPS graph | |||
image:Debug_info_stats.jpg|Statistics | |||
image:Debug_info_status.jpg|Status info | |||
image:Debug_info_visibility.jpg|Visibility info | |||
</gallery> | |||
<code>Scroll lock</code> cycles through various debug views: | |||
<gallery widths=320px heights=240px> | |||
image:Debug_view_entities.jpg|Entity IDs and bounding boxes | |||
image:Debug_view_skeletons.jpg|Skeletons and attachment points | |||
image:Debug_view_zones.jpg|Zones and controlling entities | |||
image:Debug_view_paths.jpg|Paths | |||
image:Debug_view_pathfinding.jpg|Pathfinding | |||
image:Debug_view_lights.jpg|Lights | |||
image:Debug_view_fogs.jpg|Fogs | |||
image:Debug_view_collisions.jpg|Collision shapes | |||
image:Debug_view_portals.jpg|Portals | |||
image:Debug_view_materials.jpg|Materials | |||
</gallery> | |||
== Debug log output == | |||
The <code>LogDebug()</code> macro can be used to add debug output that is disabled by default. | |||
In a non-debug build (<code>-DARX_DEBUG=0</code>), <code>LogDebug()</code> is discarded completely. | |||
In a debug build (<code>-DARX_DEBUG=1</code>), the debug output is still disabled by default, but can be enabled by runtime settings. This is done with the <code>ARXDEBUG</code> environment variable, the the <code>--debug=</code> command-line parameter and/or the <code>debug</code> setting in <code>cfg.ini</code> under <code>[misc]</code>. Each of those parameters specifies a comma-separated list of "component=level" or "component" entries. | |||
Components can be any path component that is either the <code>src</code> or "tools" directory or a subdirectory or a filename (not including the file extension). Settings for more specific components override more general settings. | |||
Valid levels are: | |||
* <code>Logger::Debug</code>: <b>debug</b> / <b>d</b> / <b>D</b> (default if level is omitted) | |||
* <code>Logger::Info</code>: <b>info</b> / <b>i</b> / <b>I</b> | |||
* <code>Logger::Warning</code>: <b>warning</b> / <b>warn</b> / <b>w</b> / <b>W</b> | |||
* <code>Logger::Error</code>: <b>error</b> / <b>e</b> / <b>E</b> | |||
* <code>Logger::None</code>: <b>none</b> / <b>n</b> / <b>N</b> | |||
* <code>Logger::Reset</code>: <b>reset</b> / <b>r</b> / <b>R</b> / <b>-</b> (nullifies any previous entry with exactly the same component name) | |||
If the same component is occurs in multiple parameters, <code>cfg.ini</code> takes precedence over the command-line parameter, which takes precedence over the environment variable. | |||
Example: | |||
$ arx --debug=cinematic | |||
== OpenGL debugging == | |||
=== Driver debug output === | |||
Modern OpenGL provides a facility for drivers to report error messages, performance warnings, suggestions and other debug information via the [https://www.opengl.org/registry/specs/ARB/debug_output.txt ARB_debug_output] extension. Arx Libertatis 1.2 can request an OpenGL debug context and enable debug message reporting. This is done automatically for debug builds (when passing <code>-DCMAKE_BUILD_TYPE=Debug</code> or <code>-DDEBUG=1</code> to <code>cmake</code>) except for <code>--benchmark</code> mode. For release builds you need to use the <code>--debug-gl</code> command-line parameter: | |||
$ arx --debug-gl | |||
If everything went well you should see message like this in the log output: | |||
{{green|'''[I]''' GLDebug}}:{{yellow|90 }}Application info #1: OpenGL debug output enabled | |||
The amount and quality of the debug information printed depends on your OpenGL driver. | |||
In release builds, Arx Libertatis will use a [https://www.khronos.org/registry/OpenGL/extensions/KHR/KHR_no_error.txt KHR_no_error] context where the driver does not check for invalid API usage. To enable that in debug builds, use <code>--debug-gl=noerror</code>. | |||
When using buggy third-party injectors such as the [[Steam#Linux|Steam overlay under Linux]] it may be necessary to re-enable API error checking using <code>--debug-gl=ignored</code> in order to avoid undefined behavior. | |||
=== Disabling OpenGL extensions === | |||
Arx Libertatis will aggressively make use of optional OpenGL extensions beyond the baseline OpenGL 1.5 (or 1.4 + GL_ARB_vertex_buffer_object) requirement except for known bad drivers where we ignore certain extensions by default. This behavior can be overridden using the <code>--override-gl</code> option or the <code>extension_override</code> setting in the <code>[video]</code> section of cfg.ini. | |||
Disabled extensions (either by built-in rules or user overrides) are logged: | |||
{{green|'''[I]''' OpenGLUtil}}:{{yellow|193 }}Ignoring OpenGL extension GL_ARB_texture_non_power_of_two | |||
Overrides can disable individual extensions: | |||
$ arx --override-gl="-GL_ARB_texture_non_power_of_two" | |||
You can also re-enable extensions that were disabled by built-in rules: | |||
$ arx --override-gl="+GL_ARB_texture_non_power_of_two" | |||
(This will not enable extensions your driver does not claim to support!) | |||
A short-hand to enable all extensions is: | |||
$ arx --override-gl="+" | |||
It is also possible to disable all extensions beyond the base OpenGL version reported by your driver: | |||
$ arx --override-gl="-" | |||
Or enable only core extensions that are part of a specific OpenGL version (e.g. do not use anything beyond minimum requirements): | |||
$ arx --override-gl="1.5" | |||
Multiple overrides can be specified by separating them using spaces in the <code>--override-gl</code> argument and/or <code>extension_override</code> setting. <code>--override-gl</code> overrides the <code>extension_override</code> setting, which in turn overrides the built-in rules which in turn override the extensions reported by the driver. For each setting, rules towards the right take precedence over rules towards the left. E.g. --override-gl="+GL_ARB_texture_non_power_of_two 1.5" is equivalent to just --override-gl="1.5" but --override-gl="1.5 +GL_ARB_texture_non_power_of_two" is not. | |||
== | == Linux == | ||
=== GDB === | |||
<code> | Start arx in the debugger by running <code>gdb ./arx</code> and then entering <code>run</code> run. You can pause arx and return to the gdb prompt at any time by sending arx the SIGINT signal (<code>Ctrl+C</code> in the console). | ||
Perhaps the most used function is to generate backtraces using the <code>backtrace</code> (or shorter <code>bt</code>) command in the gdb prompt. | |||
<code> | To also include local variables and not just function arguments in the backtrace use <code>bt full</code> | ||
By default, gdb will only print scalar function arguments in backtraces and replace classes with <code>...</code>. To print all function arguments use <code>set print frame-arguments all</code>. | |||
When printing objects, gdb will also include all static members of the class. This is often not needed and can be disabled with `set print static-members off` | |||
Many stl classes check for error conditions when compiling in debug mode and throw an exception on failure. To get a backtrace for where the exception was thrown, add a breakpoint on the exception constructor. Enter this in the gdb prompt. | Many stl classes check for error conditions when compiling in debug mode and throw an exception on failure. To get a backtrace for where the exception was thrown, add a breakpoint on the exception constructor. Enter this in the gdb prompt. | ||
b std::logic_error::logic_error | |||
b std::runtime_error::runtime_error | |||
If entering these commands into gdb on each run is to cumbersome, you can create a file called <code>.gdbinit</code> that is loaded by gdb on startup and contains default settings for gdb: | |||
<code>b std::runtime_error::runtime_error</ | <pre class="code"> | ||
set breakpoint pending on | |||
b std::logic_error::logic_error | |||
b std::runtime_error::runtime_error | |||
set print static-members off | |||
</pre> | |||
The extra <code>set breakpoint pending on</code> command is needed because <code>.gdbinit</code> is loaded before any libraries and therefore gdb will not be able to find the breakpoints right away. | |||
<code> | As already seen for stl exceptions, the <code>b</code> command can be used to tell gdb to halt the execution if the program reaches a specific point. | ||
b | |||
</code> | |||
You can then inspect the program state with the <code>p <expression></code> command. | |||
More commands are discussed in [https://www.cs.cmu.edu/~gilpin/tutorial/ this tutorial] or the [https://www.gnu.org/s/gdb/documentation/ gdb documentation]. A lot of common questions are answered in this [http://www.unknownroad.com/rtfm/gdbtut/ gdb FAQ]. | |||
==== Attaching to existing processes ==== | ==== Attaching to existing processes ==== | ||
Sometimes it can be useful to debug a program that is already running. You can do this by running <code>attach <pid></code> instead of <code>run</code> in the gdb prompt. You can get the pid of arx with the | Sometimes it can be useful to debug a program that is already running. You can do this by running <code>attach <pid></code> instead of <code>run</code> in the gdb prompt. You can get the pid of arx with the <code>pidof arx</code> command. | ||
Alternatively you can attach directly when starting gdb: | Alternatively you can attach directly when starting gdb: | ||
gdb --pid `pidof arx` | |||
=== Valgrind === | === Valgrind === | ||
| Line 51: | Line 144: | ||
==== Callgrind ==== | ==== Callgrind ==== | ||
[http://valgrind.org/docs/manual/cl-manual.html Callgrind] can be used to profile arx and generate a detailed call graph which can then be viewed using tools like [ | [http://valgrind.org/docs/manual/cl-manual.html Callgrind] can be used to profile arx and generate a detailed call graph which can then be viewed using tools like [https://kcachegrind.github.io/]. Like other valgrind tools, callgrind will considerably slow down the execution of the profiled program. Callgrind can be started using: | ||
valgrind --tool=callgrind -- ./arx | |||
==== Memcheck ==== | ==== Memcheck ==== | ||
| Line 59: | Line 152: | ||
[http://valgrind.org/docs/manual/mc-manual.html Memcheck] can detect memory access errors such as accessing unallocated/freed data, buffer overruns, using uninitialized values and memory leaks. To generate a very detailed report, run arx under valgrind with this command: | [http://valgrind.org/docs/manual/mc-manual.html Memcheck] can detect memory access errors such as accessing unallocated/freed data, buffer overruns, using uninitialized values and memory leaks. To generate a very detailed report, run arx under valgrind with this command: | ||
valgrind --tool=memcheck --error-limit=no --leak-check=full "--log-file=arx-valgrind-%p.log" -v --track-origins=yes -- ./arx | |||
Memcheck will slow down the program even more than callgrind. Because the timing code in arx isn't very good, this can cause some cutscenes to fail (for example, the intro never finishes). | Memcheck will slow down the program even more than callgrind. Because the timing code in arx isn't very good, this can cause some cutscenes to fail (for example, the intro never finishes). | ||
| Line 73: | Line 166: | ||
<pre class="code"> | <pre class="code"> | ||
# Alsa is buggy, from http://winezeug.googlecode.com/svn/trunk/valgrind/valgrind-suppressions | # Alsa is buggy, from http://winezeug.googlecode.com/svn/trunk/valgrind/valgrind-suppressions | ||
{ | { | ||
| Line 192: | Line 216: | ||
} | } | ||
</pre> | </pre> | ||
=== apitrace === | |||
[https://github.com/apitrace/apitrace apitrace] can record all OpenGL calls made by arx. There is also a GUI that let's you inspect the generated trace and view the complete OpenGL state at each call. (including renderbuffer and textures) | |||
Arx Libertatis will by default use persistently mapped coherent buffers without explicit synchronization to upload vertex data, if supported by your GPU and driver. Vertex data uploaded in this way can not be recorded by apitrace, resulting in broken traces. To fix this, pass disable GL_ARB_buffer_storage when recording traces: | |||
$ apitrace trace arx --override-gl="-GL_ARB_buffer_storage" | |||
== Windows (MSVC debugger) == | == Windows (MSVC debugger) == | ||
See [[Downloading and Compiling under Windows]] | See [[Downloading and Compiling under Windows]] | ||
[[Category:Development information]] | |||
Latest revision as of 03:37, 9 January 2022
This article explains how to debug Arx Libertatis.
Script console
- Main article: Script console.
Arx Libertatis 1.2 and newer comes with a console that can run arbitrary script commands. In debug builds and development snapshots it can be opened using the hotkey (` by default) while in release builds a cheat spell is required to unlock the hotkey.
Debug views
F11 cycles through various debug information displays:
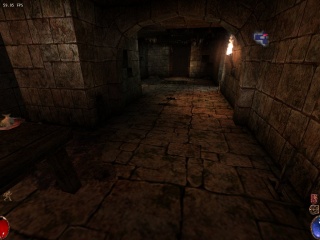
FPS counter
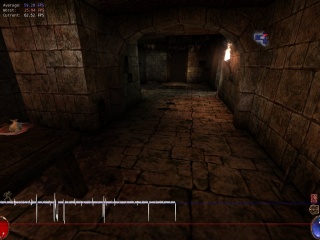
FPS graph
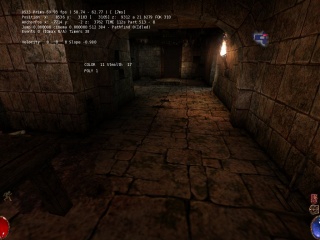
Statistics
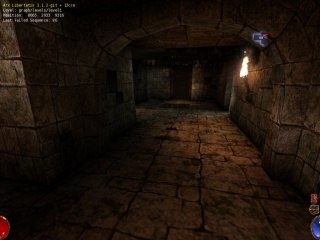
Status info
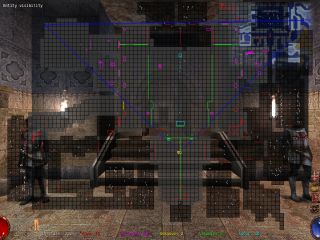
Visibility info


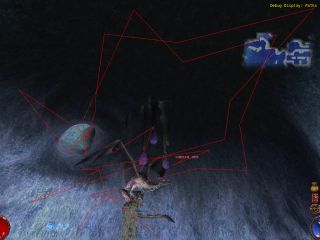
Scroll lock cycles through various debug views:
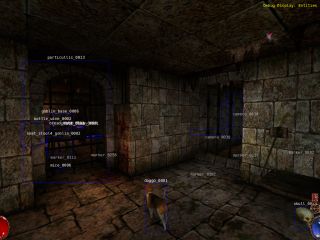
Entity IDs and bounding boxes
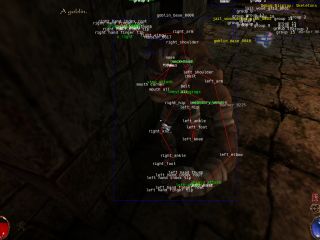
Skeletons and attachment points
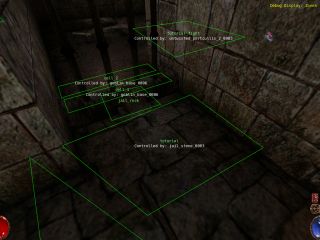
Zones and controlling entities
Paths
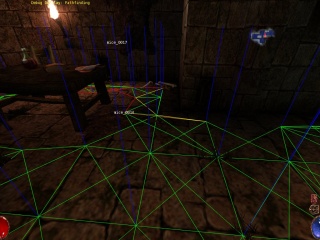
Pathfinding
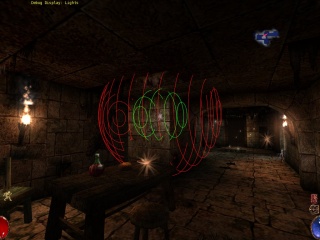
Lights
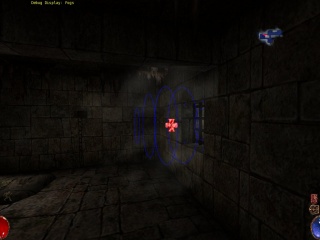
Fogs
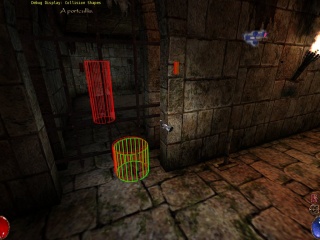
Collision shapes
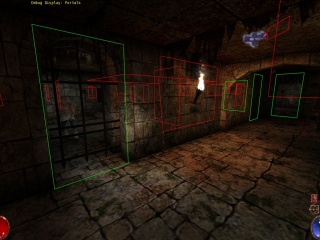
Portals
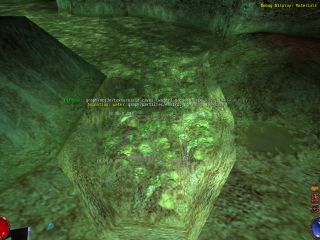
Materials


Debug log output
The LogDebug() macro can be used to add debug output that is disabled by default.
In a non-debug build (-DARX_DEBUG=0), LogDebug() is discarded completely.
In a debug build (-DARX_DEBUG=1), the debug output is still disabled by default, but can be enabled by runtime settings. This is done with the ARXDEBUG environment variable, the the --debug= command-line parameter and/or the debug setting in cfg.ini under [misc]. Each of those parameters specifies a comma-separated list of "component=level" or "component" entries.
Components can be any path component that is either the src or "tools" directory or a subdirectory or a filename (not including the file extension). Settings for more specific components override more general settings.
Valid levels are:
Logger::Debug: debug / d / D (default if level is omitted)Logger::Info: info / i / ILogger::Warning: warning / warn / w / WLogger::Error: error / e / ELogger::None: none / n / NLogger::Reset: reset / r / R / - (nullifies any previous entry with exactly the same component name)
If the same component is occurs in multiple parameters, cfg.ini takes precedence over the command-line parameter, which takes precedence over the environment variable.
Example:
$ arx --debug=cinematic
OpenGL debugging
Driver debug output
Modern OpenGL provides a facility for drivers to report error messages, performance warnings, suggestions and other debug information via the ARB_debug_output extension. Arx Libertatis 1.2 can request an OpenGL debug context and enable debug message reporting. This is done automatically for debug builds (when passing -DCMAKE_BUILD_TYPE=Debug or -DDEBUG=1 to cmake) except for --benchmark mode. For release builds you need to use the --debug-gl command-line parameter:
$ arx --debug-gl
If everything went well you should see message like this in the log output:
[I] GLDebug:90 Application info #1: OpenGL debug output enabled
The amount and quality of the debug information printed depends on your OpenGL driver.
In release builds, Arx Libertatis will use a KHR_no_error context where the driver does not check for invalid API usage. To enable that in debug builds, use --debug-gl=noerror.
When using buggy third-party injectors such as the Steam overlay under Linux it may be necessary to re-enable API error checking using --debug-gl=ignored in order to avoid undefined behavior.
Disabling OpenGL extensions
Arx Libertatis will aggressively make use of optional OpenGL extensions beyond the baseline OpenGL 1.5 (or 1.4 + GL_ARB_vertex_buffer_object) requirement except for known bad drivers where we ignore certain extensions by default. This behavior can be overridden using the --override-gl option or the extension_override setting in the [video] section of cfg.ini.
Disabled extensions (either by built-in rules or user overrides) are logged:
[I] OpenGLUtil:193 Ignoring OpenGL extension GL_ARB_texture_non_power_of_two
Overrides can disable individual extensions:
$ arx --override-gl="-GL_ARB_texture_non_power_of_two"
You can also re-enable extensions that were disabled by built-in rules:
$ arx --override-gl="+GL_ARB_texture_non_power_of_two"
(This will not enable extensions your driver does not claim to support!)
A short-hand to enable all extensions is:
$ arx --override-gl="+"
It is also possible to disable all extensions beyond the base OpenGL version reported by your driver:
$ arx --override-gl="-"
Or enable only core extensions that are part of a specific OpenGL version (e.g. do not use anything beyond minimum requirements):
$ arx --override-gl="1.5"
Multiple overrides can be specified by separating them using spaces in the --override-gl argument and/or extension_override setting. --override-gl overrides the extension_override setting, which in turn overrides the built-in rules which in turn override the extensions reported by the driver. For each setting, rules towards the right take precedence over rules towards the left. E.g. --override-gl="+GL_ARB_texture_non_power_of_two 1.5" is equivalent to just --override-gl="1.5" but --override-gl="1.5 +GL_ARB_texture_non_power_of_two" is not.
Linux
GDB
Start arx in the debugger by running gdb ./arx and then entering run run. You can pause arx and return to the gdb prompt at any time by sending arx the SIGINT signal (Ctrl+C in the console).
Perhaps the most used function is to generate backtraces using the backtrace (or shorter bt) command in the gdb prompt.
To also include local variables and not just function arguments in the backtrace use bt full
By default, gdb will only print scalar function arguments in backtraces and replace classes with .... To print all function arguments use set print frame-arguments all.
When printing objects, gdb will also include all static members of the class. This is often not needed and can be disabled with `set print static-members off`
Many stl classes check for error conditions when compiling in debug mode and throw an exception on failure. To get a backtrace for where the exception was thrown, add a breakpoint on the exception constructor. Enter this in the gdb prompt.
b std::logic_error::logic_error
b std::runtime_error::runtime_error
If entering these commands into gdb on each run is to cumbersome, you can create a file called .gdbinit that is loaded by gdb on startup and contains default settings for gdb:
set breakpoint pending on
b std::logic_error::logic_error
b std::runtime_error::runtime_error
set print static-members off
The extra set breakpoint pending on command is needed because .gdbinit is loaded before any libraries and therefore gdb will not be able to find the breakpoints right away.
As already seen for stl exceptions, the b command can be used to tell gdb to halt the execution if the program reaches a specific point.
You can then inspect the program state with the p <expression> command.
More commands are discussed in this tutorial or the gdb documentation. A lot of common questions are answered in this gdb FAQ.
Attaching to existing processes
Sometimes it can be useful to debug a program that is already running. You can do this by running attach <pid> instead of run in the gdb prompt. You can get the pid of arx with the pidof arx command.
Alternatively you can attach directly when starting gdb:
gdb --pid `pidof arx`
Valgrind
Callgrind
Callgrind can be used to profile arx and generate a detailed call graph which can then be viewed using tools like [1]. Like other valgrind tools, callgrind will considerably slow down the execution of the profiled program. Callgrind can be started using:
valgrind --tool=callgrind -- ./arx
Memcheck
Memcheck can detect memory access errors such as accessing unallocated/freed data, buffer overruns, using uninitialized values and memory leaks. To generate a very detailed report, run arx under valgrind with this command:
valgrind --tool=memcheck --error-limit=no --leak-check=full "--log-file=arx-valgrind-%p.log" -v --track-origins=yes -- ./arx
Memcheck will slow down the program even more than callgrind. Because the timing code in arx isn't very good, this can cause some cutscenes to fail (for example, the intro never finishes).
To make memcheck run faster, you can disable some of it's features that you don't need:
- Memory leaks: --leak-check=no
- Uninitialized values: --track-origins=no --undef-value-errors=no
For a full list of options see the memcheck manual
Because of bugs in libraries or because valgrind doesn't understand how some OpenGL implementations map HW buffers (notably the AMD binary drivers), there will most likely be a lot of false positives. Valgrind supports suppression files to handle bugs libraries that you don't want to debug: --suppressions=suppressions.txt. This is not a very good solution for the HW buffers that valgrind doesn't understand as they are also accessed directly from arx code.
A starting point for a suppression file is:
# Alsa is buggy, from http://winezeug.googlecode.com/svn/trunk/valgrind/valgrind-suppressions
{
   suppress_libasound_overlap
   Memcheck:Overlap
   fun:memcpy
   obj:/usr/lib*/libasound.so.2.0.0
}
{
   suppress_libasound_connect
   Memcheck:Param
   socketcall.connect(serv_addr..sun_path)
   obj:*
   obj:/usr/lib*/libasound.so.2.0.0
}
{
   suppress_libasound_connect2
   Memcheck:Cond
   fun:snd_pcm_direct_client_connect
   obj:/usr/lib*/libasound.so.2.0.0
}
{
   suppress_libasound_bind
   Memcheck:Param
   socketcall.bind(my_addr..sun_path)
   obj:*
   obj:/usr/lib*/libasound.so.2.0.0
}
{
   suppress_libasound_ioctl
   Memcheck:Param
   ioctl(arg)
   obj:*
   obj:/usr/lib*/libasound.so.2.0.0
}
{
   suppress_libasound_ioctl2
   Memcheck:Param
   ioctl(arg)
   obj:*
   fun:ioctl
   obj:/usr/lib*/libasound.so.2.0.0
}
{
   suppress_libasound_semctl
   Memcheck:Param
   semctl(IPC_SET, arg.buf)
   obj:*
   obj:/usr/lib*/libasound.so.2.0.0
}
apitrace
apitrace can record all OpenGL calls made by arx. There is also a GUI that let's you inspect the generated trace and view the complete OpenGL state at each call. (including renderbuffer and textures)
Arx Libertatis will by default use persistently mapped coherent buffers without explicit synchronization to upload vertex data, if supported by your GPU and driver. Vertex data uploaded in this way can not be recorded by apitrace, resulting in broken traces. To fix this, pass disable GL_ARB_buffer_storage when recording traces:
$ apitrace trace arx --override-gl="-GL_ARB_buffer_storage"